

Accurate financial reporting communicates vital information about a company’s economic activities to business leaders, investors, and regulatory agencies. Yet, for many, this business function can seem mysterious. Below, we provide an overview of financial reporting, its purpose, and examples of key reports. Then, we offer tips for developing an effective reporting process and a free download.
Table of Contents
What is Financial Reporting?
Financial reporting is the practice of capturing, organizing, and delivering critical information about a company’s business activities and financial performance to key stakeholders each month, quarter, and year. Accountants compile details about your account balances, financial obligations, and inflows and outflows of cash into standardized reports. Then, ideally, your finance team will analyze the data and combine it with your projections to develop digestible and actionable insights.
Financial reporting is a necessary (and sometimes legal) obligation for businesses of every size. Some small companies can get by with basic internal financial reporting as provided by accounting – i.e., a simple snapshot of where you have been and where things stand today. But organizations with complex operations or that want to grow and scale must become more sophisticated, so I will explain how reporting can evolve later in this post.
Reputable accountants and financial professionals follow specific rules and standards when generating financial reports, depending on the company’s location. In the United States, most adhere to Generally Accepted Accounting Principles (GAAP), rules and guidelines set forth by the Financial Accounting Standards Board (FASB). Most companies outside the U.S. follow the International Financial Reporting Standards (IFRS).
What is the Objective of Financial Reporting?
The primary purpose of financial reporting is to provide crucial insights to your executive team for effective decision-making while capturing the financial data you must share with external entities. However, that is a simple answer to a complex question. Let’s look at the many ways you can use your financial information.
Track Your Company’s Current Financial Health
Basic financial reporting provides visibility into where you have been and the current state of your company’s finances. When your executive team reviews this data each month, they should be able to answer critical questions that will help them run the business, given the current condition of your operations, such as the following.
- Is our company profitable?
- Have we hit the objectives set forth by our investors or lenders?
- How are we managing our growth? Do we need to find better ways to scale?
- Are we promptly collecting receivables? If not, how is that affecting our cash flow?
- Is our financial structure healthy, or is our mix of debt and equity imbalanced and a potential red flag to future creditors and investors?
Forecast Trends and Prepare for the Future
Knowing how your company is doing today is undoubtedly helpful. Yet the real power of financial reporting lies in analyzing the trends and combining the data with projections to spot problems or opportunities. In other words, you can use the data to predict where you are heading compared to your goals and address potential issues before they occur, making it easier to keep your company on track. For instance, savvy business leaders use this approach to answer questions like these.
- If we are not profitable yet, when will that occur?
- Are we on track to hit our revenue or customer acquisition targets?
- Will we be able to stay within budget?
- Do we have enough cash to pay our suppliers and employees in the coming months? If not, how much is left?
- If we close a big deal in the pipeline, do we have the resources to fulfill that obligation?
Analyze the Potential of Proposed Initiatives
Once you have built in your projections, you can also run what-if scenarios to model the potential effects of proposed initiatives. Once again, improving your ability to make sound business decisions, such as the following.
- Should we borrow more money to invest in marketing, people, or machinery?
- Do we need to raise outside capital (equity)?
- Can we afford to acquire a particular company or expand into a new market?
- Would it be better for us to grow organically by increasing our output or investing in advertising, or should we seek a merger, acquisition, or partnership?
- How long will it take to achieve a return on our investment if we invest in new technology?
- How would it affect our cash flow if we eliminated a certain percentage of our workforce?
Communicate Important Data to Company Stakeholders
It is not only leadership that needs financial information. Other internal and external stakeholders also rely on this data. For example, department heads and certain managers will use financial data to inform decisions about discrete areas of your business, and employees look to company performance for motivation. A healthy business suggests career and earnings potential, especially if your compensation plans include profit sharing or equity.
External stakeholders, such as current and potential investors and creditors, also evaluate a company’s financial position. Indeed, some expect upfront and regular reporting throughout the relationship. You may need to share financial data with vendors, suppliers, or customers to assure them that you can meet your obligations. And finally, let’s not forget about your Board of Directors, which will expect high-level reporting and insights at quarterly board meetings.
Manage Compliance with Regulatory Agencies
The data generated by financial reporting will also help you meet the legal obligations of doing business. For example, the Internal Revenue Service (IRS) requires that you submit these details when filing taxes. You may also be subject to financial reporting requirements from industry-specific regulatory organizations.
Public companies must file reports with the Securities and Exchange Commission (SEC), including financial disclosures. Many produce formal annual reports detailing their performance and activities, regardless of regulations.
Given the usefulness of these reports, developing a watertight financial reporting process is in every company’s best interest. So, what types of financial statements should you expect from your finance and accounting team?
What Types of Financial Reports Do You Need?
Financial reporting occurs on a monthly, quarterly, and yearly cycle, and the contents of each statement can vary depending on the audience. For example, potential lenders typically do not consider financial projections during underwriting. Instead, they rely on a high-level snapshot of your current financial situation and historical track record to determine your ability to repay the debt. Therefore, an appropriate financial reporting package for a lender would only include your income statement, balance sheet, and statement of cash flows for the past 2-3 years.
Let’s look at examples of these three critical statements.
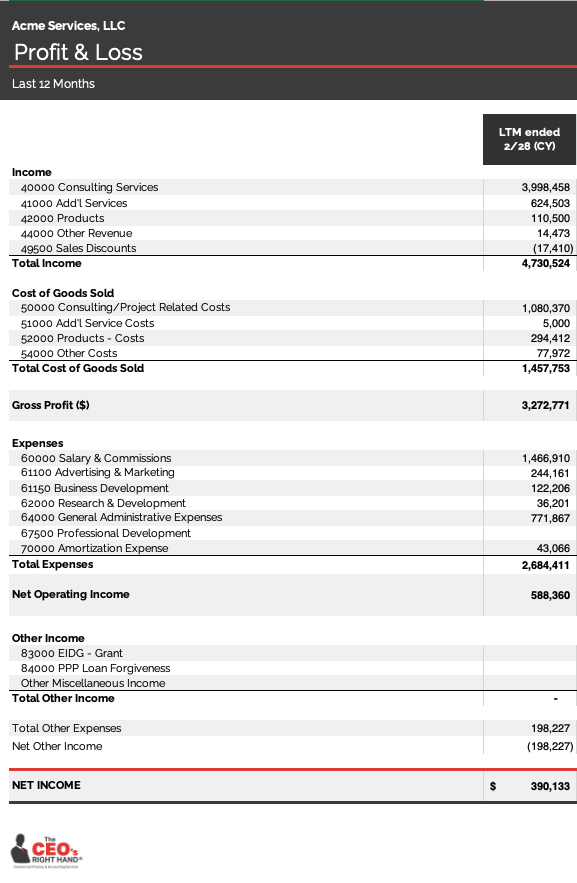
Income Statement
The income statement (a.k.a. profit and loss or P&L statement) shows the breakdown of your organization’s revenues and expenses for a certain period of time and how that translates into net profits (or losses). It is a simple report with subtotals for gross profit (revenue minus cost of revenues) and operating income (gross profit minus operating expenses), with a final tally for net income (operating income minus other income and expenses).
This report provides insight into the company’s productivity and profitability. Many also use the income statement to benchmark the company’s performance against other organizations.
Balance Sheet
In contrast, a company’s balance sheet documents an organization’s total assets, liabilities, and shareholder’s equity. It is a combination of investment made into the business and profits earned to date, i.e., retained earnings, as reported on the income statement. It provides a snapshot of where things stand at a particular point in time. Put another way, it shows how much you have and owe and the company’s net worth on a specific date.
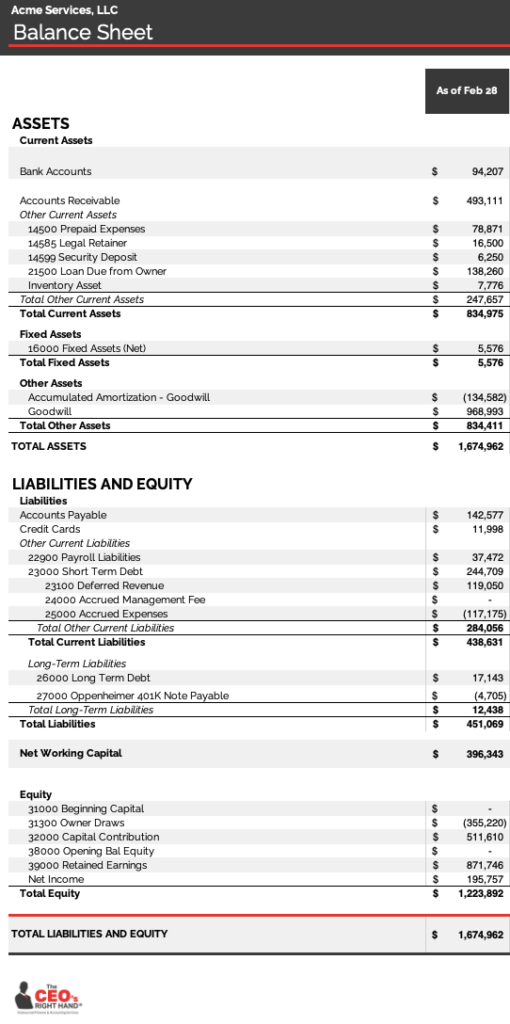
As a stand-alone document, this report speaks volumes. For instance, potential investors and creditors can use it to see whether you have a healthy balance of debt vs. equity or if you are an investment risk. They can also combine it with other financial statements to evaluate your company’s financial stability.
Statement of Cash Flows
The cash flow statement (also known as the statement of cash flows) shows how and when money flows into and out of the business. It connects the income statement and balance sheet to show all sources and uses of cash, broken down into three main areas.
- Operating Activities – changes in cash due to essential operations.
- Investment Activities – cash movement from paying for or selling the equipment or other assets you need to run your business (if any).
- Financing Activities – cash flow from obtaining credit, an equity investment, making dividend payments, or paying off loans.
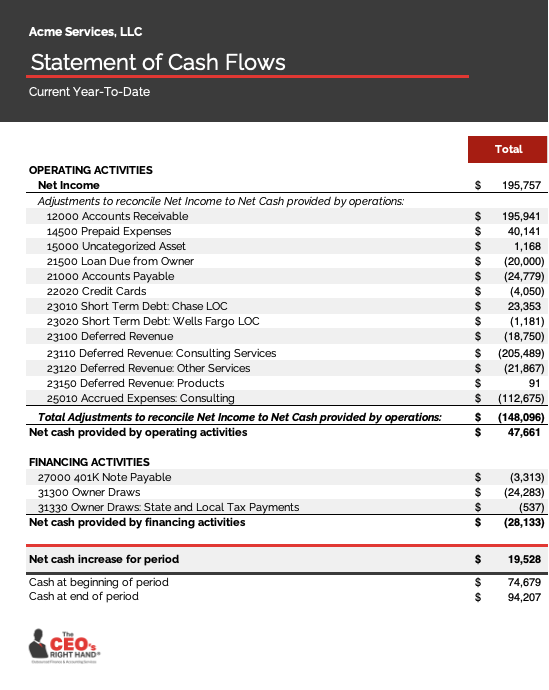
The statement of cash flows is less helpful than the prior two reports without more context, but those with financial acumen can still glean insights. For instance, a positive cash flow indicates that the company is healthy. If the company isn’t generating enough cash to cover its obligations, that is usually a problem.
Remember, the reports above are just a start. Other financial statements can also be helpful, depending on the business. For instance, accounts receivable and accounts payable aging reports can be quite telling for companies that sell business-to-business. These organizations must be mindful of bills and invoices that sit on the books for too long, putting the company at risk of cash flow problems.
How Does Financial Reporting Evolve with Your Business?
As your company matures, your executive team or board will need more information. They will need comprehensive financial reporting, including current and historical financial data analysis, projections, and insights to guide decision-making. That will empower the team with the information necessary to grow and scale the business.
Reporting packages for executives or boards will likely include the three statements above (modified to include a comparison to historical data), reports specific to the business, and the following information.
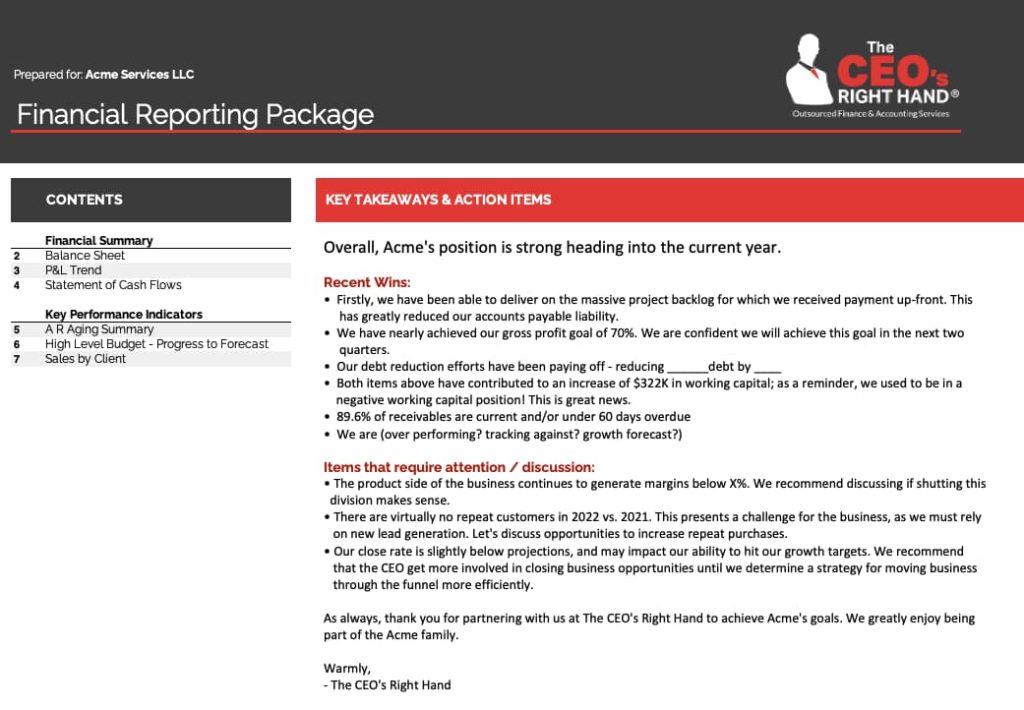
An Executive Summary
An executive summary typically precedes any financial reporting documents presented to executive teams, boards, or shareholders. It is a written financial analysis that describes what has happened since the last report (as revealed in the numbers) and the finance team’s recommendations.
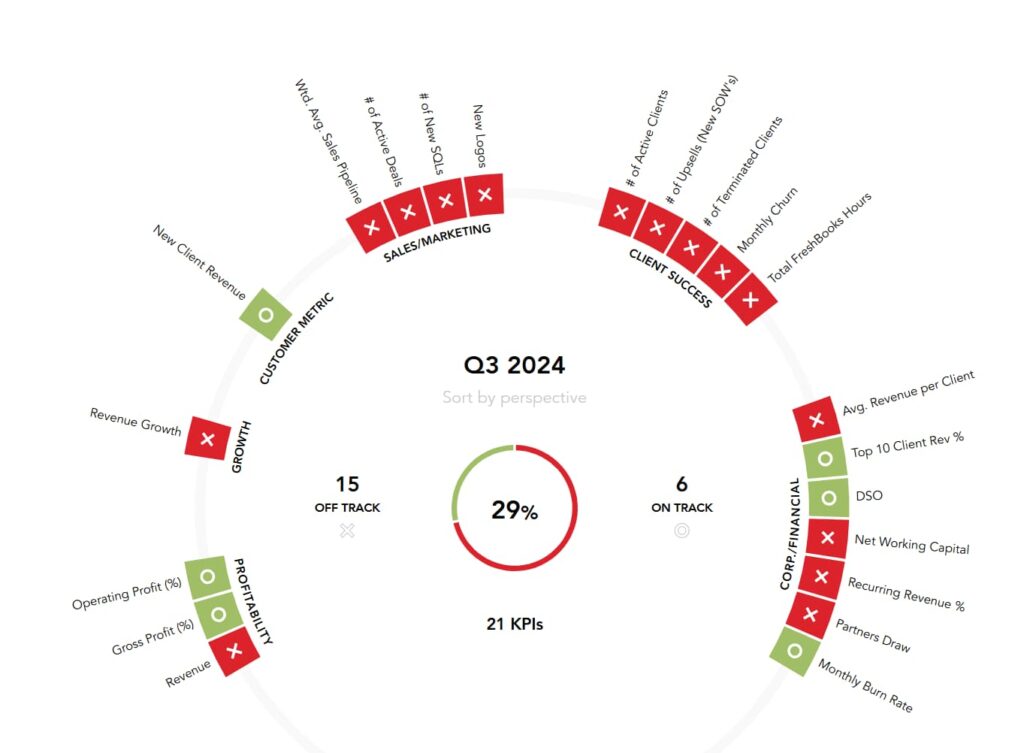
KPI Dashboard
A Key Performance Indicator (KPI) dashboard is a one-page document that displays high-level metrics about a company’s performance. It provides quick insight into whether the business is on track to achieve its goals, enabling you to spot and address issues before they spiral out of control.
We recommend limiting the KPI Dashboard to a few areas, like the example below. But don’t let its simplicity fool you. This critical report summarizes your most important financial data. Update the numbers every month or quarter to keep them accurate and useful.
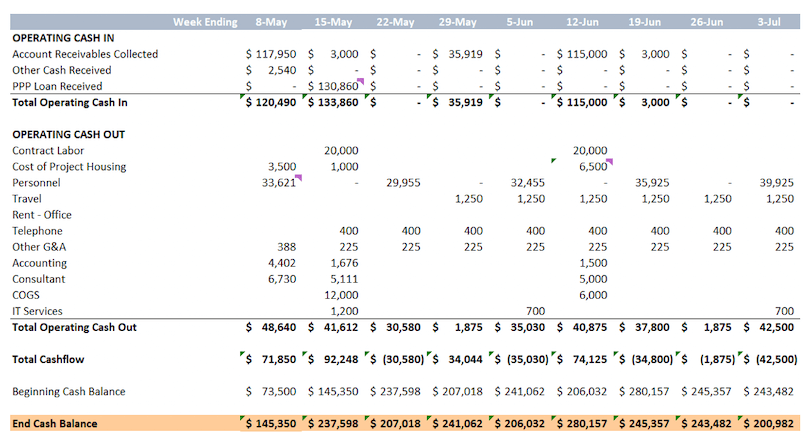
Cash Flow Forecast
A cash flow forecast is a detailed report that shows your company’s current cash position and a projection of its future cash position based on anticipated revenues and expenses. This document complements and extends your statement of cash flows report by forecasting the future, making the data more valuable and actionable. It can help you avoid any cash flow problems that might inhibit your ability to run the business.
How to Build a Reliable Financial Reporting Process?
Building a financial reporting process from scratch may sound daunting, but fortunately, it is not a one-time thing. You can start with a simple function and then let it evolve with your organization. Yet, it is wise to think ahead, so below are some tips to get you started.
- Hire an accountant and work with them to identify where your data lives. Then, select and install a tool to manage it and generate reports. Choose something that can grow with your organization and integrate with other technologies, such as your inventory management solution.
An Excel spreadsheet can serve this purpose for a while if you are comfortable uploading and downloading data to and from other systems. Download our monthly financial report Excel template for an example. - Develop policies and procedures to ensure your data is accurate and helpful for running your business. As you grow, issues such as using cash-based vs. accrual-based accounting or questionable revenue recognition practices can become problematic. These data problems compound over time and can affect your decision-making ability, so I recommend addressing them as soon as possible.
- Secure the services of your CFO (or hire a fractional CFO) to own the process of financial modeling and analysis for your executive team. Although an accountant can do much of the legwork and prepare basic financial statements, you will need someone with more experience to analyze those statements and develop actionable insights.
- If you start with an Excel spreadsheet, explore technology solutions for doing this work as your company grows. Your needs will become more complex as you scale, making more sophisticated solutions necessary. However, it should be a simple transition if you follow the steps above and have a great CFO.
Financial Reporting: Final Thoughts
Financial reporting is a crucial function that empowers you and your team with the data and insights to make decisions and communicate your economic situation to other parties. Although you can start simple, I encourage you to invest in doing it right. A monthly service, like Right Hand Finance™, is a great way to start or hire a fractional CFO for a customized solution.
Check out our article on how to read financial statements for additional reading.
Editor’s Note: This blog post was originally published in March 2022 and then updated for accuracy and thoroughness in November 2024.