

To run a business effectively, you must rise above the day-to-day and take a big-picture view. You need to know what is going well, what needs your attention, and how to prioritize. But that is not easy to do when there are too many demands on your time, and you feel stressed. It would be best to have tools, like a KPI dashboard, to make it easier.
Table of Contents
What is a KPI?
A Key Performance Indicator (KPI) is a high-level measure of a particular aspect of your business. It gives you a quick sense of whether your company is on track to meet its goals.
Technically, a KPI is a metric, yet only some metrics are KPIs. Your organization uses an array of metrics to gauge the success of various initiatives and business processes. KPIs are the most critical – the metrics your team can use to measure your overall business performance, gain actionable insights, and inform decisions.
For example, one obvious KPI is revenue. If your company is at risk of missing its revenue goals, you must investigate the cause and find solutions. However, there are other high-level KPIs to consider. These include operational KPIs that measure your activity (like the number of customers you gain in a month) and financial KPIs that you can derive from your accounting system (like profit). So, the challenge with KPI tracking is that you must narrow your focus to the most meaningful metrics. Only then can you create a KPI dashboard.
What is a KPI Dashboard?
A key performance indicator dashboard is simply a visualization of your KPIs designed for easy consumption. When data is easily digestible, you feel less overwhelmed. You can quickly get a good sense of your company’s health, spot problems, and deal with them before they spin out of control.
The No-BS Financial Playbook for Small Business CEOs
Are you tired of making costly financial mistakes? Stop guessing and start growing. Learn how to create a scalable and valuable company while minimizing risk with this playbook from a serial entrepreneur who has been in your shoes.
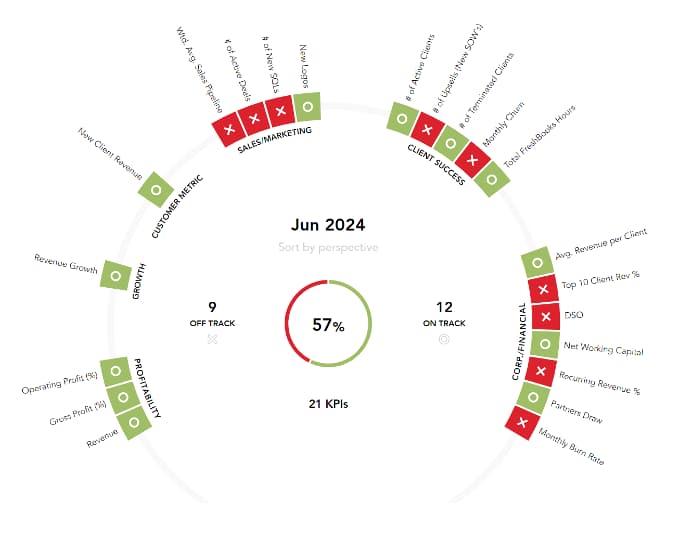
One approach that many business leaders use is to display KPIs using a familiar color-coding system, like red and green. Red indicates a problem area, and green means you’re doing great. The eye is naturally drawn to the numbers that matter so you can see how the business is doing at a glance. Below is a KPI dashboard example to show you what this looks like.
What is the Purpose of a KPI Dashboard?
A KPI dashboard is an easy-to-use tool for monitoring your company’s performance. It clearly shows when your business is thriving and when it needs work.
Referring to the example above, you will see that we have narrowed the focus to six areas, each with one or more KPIs. With our clients, we recommend limiting this report to just a handful of functional areas to keep the information useful and consumable.
For instance, the section for Profitability KPIs includes three measures: Operating Profit, Gross Profit, and Revenue. All three KPIs are green in this example, so everything is humming along well from a profitability (and revenue) perspective. However, when we look at the Sales and Marketing KPIs, we are not performing. You can tell because three of the four KPIs in that section are red.
Ideally, you will also use your KPI dashboard as a benchmark – comparing your company with others in your industry. If your numbers are notably higher or lower than your competition, that’s a red flag. It is a sign that you should investigate why that is the case and what (if anything) you should do about it.
Should You Have a KPI Dashboard for Every Department Leader?
We developed the example executive dashboard above with the CEO in mind, and if you’re running a small to medium-sized business, this is probably all you need. However, as your company grows and becomes more complex, you might create a KPI dashboard for each department leader.
You could have an operational dashboard, a marketing dashboard, and others for customer satisfaction and human resources. Each department leader can identify their KPIs, showing how their group’s performance contributes to the company’s goals. They may even encourage various team members to create dashboards of their own. But, for now, let’s start with one.
It is also worth noting that when your organization gets to a point where you need deeper insight, it may be time to invest in a business intelligence (BI) solution, like Tableau or Microsoft PowerBI. These data visualization tools pull all your information into one place. In addition to your KPIs, you gain access to the underlying numbers (potentially in real-time) and can view them in different ways. Such tools are expensive, however, so most growing companies start with a simple Excel spreadsheet.
How to Build a KPI Dashboard
So, how do you make a KPI dashboard? As you might imagine, there’s not just one way to go about it. The process will vary from company to company, and become more involved as your business grows. In general, however, these are the basic steps for building an effective KPI dashboard:
1. Build a Strong Financial and Operational Model
This model will contain the detailed (month-by-month) underlying data that will roll into your KPI dashboard. Capture everything you know about your current and anticipated revenue and expenses, including things that will influence these numbers (like marketing and sales team activity). With smaller companies, we typically do this in a spreadsheet (or using TCRH’s reporting tool). Then, we project our financial results (based on the historical results and trends), including revenues and expenses, for the next twelve months.
2. Set Goals
Determine what short and long-term targets you must hit and when to keep your business on track. These are the numbers you will use to gauge your performance each month. So, although it is great to be optimistic, it is also important to be realistic and mindful of your capabilities.
3. Identify Potential KPIs

Given the information you gathered in steps 1 and 2, determine which metrics are candidates for your KPI dashboard. Again, these are high-level, important metrics that demonstrate the health of your business and will be helpful to your management team in pursuing strategic goals. In other words, they should be actionable. You should have solutions prepared that will get you back on track should you notice that you are likely to miss the mark with one of your KPIs.
Many of our clients like to use the “SMART” goals framework to narrow the possibilities, whereby each potential KPI must be Specific, Measurable, Achievable, Realistic, and Timely. I encourage this as it lends focus. Then, once we have a list of potential KPIs, we discuss the candidates until we agree upon the 3-6 most important ones.
4. Review Your Historical Data for Those KPIs
Now, you must look at the machinery to track your KPIs. What are your data sources? Will you be able to see the trends? Or do you need to implement some systems to get to this information?
5. Build the KPI Dashboard
Create a new sheet for your dashboard in the same spreadsheet where you developed your financial and operational model. Build it to pull the necessary information from the underlying numbers and update automatically each month when you add new data. Remember, this should be a one-page, easy-to-understand spreadsheet allowing you to spot issues quickly.
Once you have gone through this process, you will update your numbers every month. Then, the executive team will get into a monthly rhythm of reviewing the data, discussing its meaning, and making data-driven decisions.
Which KPIs Should You Track for Your Business?
Picking the right KPIs for your business can be tricky as it depends on your industry, your company’s maturity, and your business model. So, although knowing what other companies use or what is typical in your industry can be helpful, you will need to create a customized KPI dashboard for your needs. For instance, most businesses track some variation of the following KPIs:
- Revenue Growth
- Gross Margins
- Net Income
However, the language and specific calculations each company uses will differ by industry and even further based on the business model. Here are just a few examples:
KPIs for SaaS or Subscription-Based Industries
When you build on your relationships with customers and compound earnings year after year, you track things differently from industries where customers come and go based on one-time needs. Here are some common key performance indicators for these types of businesses.
- Monthly Recurring Revenue (MRR) or Annual Recurring Revenue (ARR)
SaaS companies use a recurring revenue model. Therefore, the management teams of these companies focus heavily on growing their monthly recurring revenues (MRR) or annual recurring revenues (ARR). Recurring revenues are much more valuable to a SaaS company than one-time revenues, so reporting on this KPI is critical. A variation on MRR is Contracted Monthly Recurring Revenues (CMRR), which considers pending new client revenues and terminations. - Lifetime Value of a Customer (LTV) – The Lifetime Value of a Customer represents the total revenues a customer is expected to generate throughout their total relationship with the company. For example, if a customer generates $5,000 per month, on average, and the average length of a customer contract is three years, then the average LTV is $180,000. There are two ways of increasing the LTV for your company: increase the amount of MRR you can charge for your solution or increase the length of time a customer will remain.
- Customer Acquisition Costs (CAC) – Customer Acquisition Cost is the total marketing expense required to source new customers. The easiest way to calculate CAC is to add all your marketing expenses and divide that by the average number of new customers over that same timeframe.
- Churn Rate – This metric represents the percent of customers lost over a period of time. The calculation of Churn can get quite complex. However, at the simplest level, to arrive at your churn rate, take the number of customers you lost in the last period (quarter or year) and divide that number by the number you started with, i.e., at the beginning of the period.
You might also combine KPIs into a ratio to tell a bigger story. For instance, LTV:CAC (Lifetime Value divided by Customer Acquisition Costs) provides insight into how much you spend compared to what you earn. It is an indication of your profitability and efficiency. Ideally, you want this ratio to be at least 4:1, i.e., you want to generate revenues of at least four times the cost of acquiring a customer to ensure you are making enough profit from that customer.
E-commerce Business KPIs

Businesses selling relatively low-cost or commodity items online must rely on volume and a marketing machine that drives new and repeat business. In this case, the management team might want a KPI dashboard with this information:
- Average Order Value (AOV) – Average dollar size of customer orders over a period of time. You can look at this in isolation to gauge your upselling capabilities or break it down into segments in search of patterns—first-time vs. repeat customers, for instance.
- Churn Rate – In e-commerce, you want to nurture your existing customers as much as possible so they remain customers. If you lose them, that will increase your “churn” rate.
- Lifetime Value – For customers that become repeat customers, how long do they stick around, and how much do they spend on average during their entire journey with your company?
- Gross Margin – Gross Margin represents the profit you generate from selling your goods or services. To calculate Gross Margin, you subtract the total Cost of Goods Sold from your Revenues. For commodity businesses, e.g., batteries, the Gross Margin on a single unit is typically very low. Less common items will have higher margins.
- Return on Ad Spend (RoAS) – Advertising is non-negotiable in e-commerce, so RoAS and related metrics like click-thru rates and conversion rates are critical. Many break this down by channel – paid search vs. paid social media, for example.
KPIs for Companies that Provide Business Services
KPIs take an interesting turn when your revenue model relies on human capital. There are no “widgets” that have average order values. Instead, service-based businesses often depend upon people to generate revenues daily (or even hourly). Here are some KPIs that make sense for such companies.
- Billable Hours – How much time do you spend on client work vs administration? You might track this for your organization as a whole or broken down into “Billings per Employee” or “Billings by Department.”
- Gross Profit per Client – When you subtract the cost of your human capital and overhead costs from the revenue you bring in for each client, what’s left?
- Churn Rate – Do clients stay on for years or a finite amount of time? Is there anything you can do about it?
- Capacity and Capacity Utilization – There are only so many hours in the day. Are you making the most of them? Is there a way to be more efficient?
The Bottom Line
A KPI dashboard is a critical tool that empowers you to quickly assess the health of your business, spot trends, and take action. The process for building one involves a thorough assessment of your business and collaboration with your management team to ensure that the KPIs you choose to track are the right ones for you.
At The CEO’s Right Hand, we build customized KPI dashboards as part of our outsourced CFO services. We encourage you to reach out to learn more.
Editor’s Note: This blog post was originally published in March 2021 and then updated for accuracy and thoroughness in September 2024.