
Most business leaders understand that financial metrics and KPIs provide vital insight into a company’s health. Yet, they don’t always know how to track and use that information. As a fractional CFO, my job is to guide this effort – to ensure the data is correct, narrow your focus to the most critical metrics for your business, and offer strategic advice so you can make decisions. That said, there are some financial metrics and KPIs that every leader should know, so in this post, we will discuss those metrics and how they can vary by industry or growth stage.
But first, let us clarify the terminology.
What is a Financial Metric?
A financial metric is a quantitative measurement that provides insight into the quantitative performance of a company’s business operations. It is a figure or ratio that appears on, contributes to, or that you can derive from your income statement and balance sheet. These metrics help you determine if your company is on track for sustainable, long-term financial growth and viability and where your problems lie. In other words, financial metrics help us answer questions like the following:
- Revenues – What are the sources of income for your business, how do they ebb and flow over time, and what can you do about it?
- Costs – What costs must you incur to run a successful business? And how do those costs affect your overall financial performance (gross profit margin, operating margin, and net profit margin)?
- Assets and Liabilities – How much cash (working capital) do you have, and how long will it last, given your obligations and growth plans? If necessary, what can you do to increase cash flow?
- Debt and Equity – What is your balance of debt vs. equity (a/k/a debt to equity ratio), and how efficient is your usage of the company’s capital?
The trouble, however, is that there are a lot of financial metrics, and those that indicate success will change as your company evolves. That is why I encourage using financial KPIs.
The No-BS Financial Playbook for Small Business CEOs
Are you tired of making costly financial mistakes? Stop guessing and start growing. Learn how to create a scalable and valuable company while minimizing risk with this playbook from a serial entrepreneur who has been in your shoes.
What is a Financial KPI?
Financial key performance indicators (KPIs) are high-level financial metrics that indicate whether your company is on track to meeting its goals. These are the most meaningful metrics to your management team because they empower you to monitor factors directly related to your company’s health and longevity, make informed decisions, and act before issues spin out of control.
The right KPIs for your business will change over time. For instance, whereas startups typically focus on traction, mature companies often shift their attention to revenue growth, profits, and scalability. So, I recommend choosing just a handful of KPIs that reflect your company’s current goals. Then, engage the whole company by asking each department head how their team’s initiatives contribute to those goals.
10 Key Financial Metrics and KPIs for Leaders

Although I recommend focus, there are some financial metrics that every leader should know. These metrics allow you to combine data from your financial statements for deeper insight into your company’s financial health. Indeed, some of them may land on your financial KPI list.
- Annual Revenue Growth Rate
(Current Year Revenue / Prior Year Revenue – 1 = X%)
Every company tracks revenue and captures it in financial reports, but income data in isolation is not informative. The annual revenue growth rate provides context by showing how much your total sales grew or declined over the prior year.
For those who desire more timely information, you can easily adjust this metric to track quarterly or monthly growth rates instead. For a longer-term view, you can also create a compound annual growth rate over five years or more, which measures the average over time.
- Annual Gross Margin Growth Rate
(Current Year Gross Margin / Prior Year Gross Margin – 1 = X%)
To get a more accurate picture of revenue growth, we subtract the costs of generating that revenue (cost of goods sold) to arrive at your gross margin. The annual gross margin growth rate adds even more context by telling you how much your gross margin has changed since the prior period. As you collect more financial data, this metric will also show how your business has performed over time.
- Gross Margin as % of Revenues
(Gross Margin / Revenues = X%)
The gross margin ratio tells you how much profit you made after subtracting the cost of goods sold. It is a profitability ratio where the percentage represents how much you retained for each dollar earned.
Healthy gross margin ratios can vary from company to company, so finding some industry benchmarks for comparison can be helpful. In the end, however, you must decide what works for your business and then aim to improve (if necessary) by reducing costs or increasing revenues.
- Operating Expense Ratio
(Operating Expenses / Revenues = X%)
The operating expense ratio reflects how much it costs to run your “back office.” Operating expenses include all selling, general, and administrative expenses, as well as product development, R&D, customer service, and other overhead costs.
To create a scalable organization, you want an operating expense ratio that decreases over time. That indicates that you can funnel more business through the engine without increasing costs at the same rate. The lower this ratio, the better.

- Operating Cash Flow Margin
(Operating Cash Flow / Revenues = X%)
Cash flow is the key to survival when building and scaling a business. Without cash flow as the fuel, your engine will seize up and fail very quickly. The operating cash flow margin indicates how much money your business generates as a percentage of revenues. In other words, for every dollar of sales, how much cash is left after subtracting the costs of running the business?
Of course, different types of companies will have different benchmark targets. For example, a manufacturing company will have a much lower cash margin than a SaaS company with a much lower cost structure.
- Net Working Capital to Assets Ratio
(Current Assets – Current Liabilities / Total Assets = X%)
Net working capital is a measure of how much capital (i.e., money) you have to invest in the business (or payout to the owners or shareholders) at any point in time. The net working capital to assets ratio is simply the working capital you have as a percentage of your total assets. The higher the ratio, the better.
However, sometimes we use debt (i.e., liabilities) to finance short-term investments. For example, borrowing from a bank line of credit may be a good way to fund purchases from suppliers overseas. In this case, a lower ratio may be acceptable.
If you can master these first six financial metrics, you will be in good shape. But for those who want more, here are some others I find incredibly telling.
- Revenue Per Employee
(Revenue / # of Employees = $X)
Revenue per employee is an excellent number to watch over time as it measures employee productivity. We want this number to be as high as possible while keeping your employees happy and burnout-free. An occasional dip might be acceptable if you can explain it, but if the drop is a surprise, take note and investigate the cause.
Many firms can generate $200,000 or more annually per employee. Companies with a high revenue-per-employee ratio tend to be more profitable.
- Days Sales Outstanding (DSO)
(Average Accounts Receivable / (Revenues x 365) = DSO)
Days sales outstanding (DSO) tells you how long your collections process takes on average. A low DSO would suggest an efficient accounts receivable function. A high DSO might indicate a cash flow problem. As usual, the key is to determine what is healthy for your business and then track your trends over time.
For example, B2B businesses tend to have 30-day terms, so you want DSO to be around 30 – 45. If it is higher, you may need to research what is happening in your accounts receivable and collections department.
- Days Payable Outstanding (DPO)
(Average A/P / (COGS / 365) = DPO)
The days payable outstanding (DPO) metric represents how long your company takes to settle its financial obligations. This number is tricky because what is good for one company or industry may be bad for another. For instance, a high DPO might indicate healthy and proactive cash flow management if you are in the manufacturing industry and have good terms with your suppliers. However, if you are in the professional services business and hire many contractors, a high DPO could suggest a problem.

- Asset Turnover
(Revenue / Average Accounts Receivables = Asset Turnover)
The asset turnover ratio tells us how quickly a company generates revenue from its assets. This number is most telling when compared to industry benchmarks. High asset turnover can be normal in a service-based business with relatively few assets. In retail, however, if your asset turnover ratio is lower than your competition, that could indicate slow sales or inefficient management of the products you have in stock.
A more telling metric for those in the retail industry is inventory turnover. Calculated by dividing the cost of goods sold by the average inventory value, this metric tells you how often your company has sold and replenished its stock over a specific time frame. The inventory turnover metric is critical for retail; the higher it is, the better. However, it isn’t meaningful to industries that don’t function that way.
Of course, we use many other financial metrics for different purposes. For instance, I typically monitor operating cash flow along with its liquidity and solvency ratios, like the quick ratio (a/k/a acid test ratio) and debt-to-asset ratio, as these metrics provide insight into a company’s cash situation. Likewise, if the organization raised equity capital, I would also watch metrics like shareholder’s equity and return on equity in anticipation of investor questions. However, leaders don’t need this level of detail until it becomes relevant.
Industry-Specific Financial Metrics
Although the financial metrics and KPIs above will interest every leader, they can vary by industry. Here are a few examples:
eCommerce Financial Metrics
Volume is critical for an eCommerce business that sells relatively low-cost or commodity items. Therefore, most companies of this sort invest heavily in marketing and rely on nuanced revenue and profitability metrics such as:
- Average Order Value (AOV) – To reveal areas of strength or weakness for your business, you can scrutinize the average dollar size of customer orders.
- Lifetime Value of a Customer (LTV) – This metric tells you how much customers spend during their entire journey with your company.
- Customer Acquisition Cost (CAC) – In a marketing-driven business, leaders must focus on the total cost of gaining business and how it compares to AOV and LTV.
Software as a Service (SaaS) or Subscription Business Key Metrics
Subscription-based businesses build long-term relationships with customers and aim to compound their earnings each year, which means they focus on metrics like:
- Monthly Recurring Revenue (MRR) – Companies focus on revenues that recur monthly or yearly when one-time purchases are not meaningful.
- Lifetime Value of a Customer (LTV) – How much total revenue will the company earn if the average customer stays with the company for three years?
- Customer Acquisition Cost (CAC) – How much does it cost to gain a customer?
- Churn Rate – What percent of customers do you lose over a specific period?
Financial Metrics for Manufacturing
In manufacturing, you must produce quality, cost-effective products on time while keeping the work environment safe. Therefore, such businesses often focus on metrics such as these:
- Inventory Turns – How quickly do you sell the products you make?
- Defect Density – How many products become damaged during production as a percentage of the total produced?
- Capacity Utilization – How much available capacity do you have in your manufacturing process?
Services-Based Business
When a business relies on human capital to generate revenue, the metrics of interest are quite different. Services-based businesses measure:
- Billable Hours – The amount of time spent on client work vs. administration.
- Average Billing Rate – How much do you charge for client work?
- Utilization Rates – Is your team efficient with their working hours?
How to Choose the Financial Metrics and KPIs to Track for Your Business
Earlier, I mentioned that it is best to focus on just a few metrics that indicate whether your company is on track to meet its goals. In most cases, you will selectively measure some variation of revenue growth, gross margins, and net income. But when you are ready to pinpoint the most important metrics for your business, follow these steps:
- Build a Financial and Operational Model – Capture your historical revenue and expenses in a spreadsheet, then plot your projections for the next twelve months.
- Set Goals – Document the targets you must hit over this same timeframe.
- Identify Potential KPIs – Reflect on the data from steps 1 and 2 to identify your most meaningful and actionable metrics. If you have more than a handful, work with your team to whittle the list.
- Review Your Financial Data – Once your team is in alignment, make sure you have the necessary systems to track your financial KPIs.
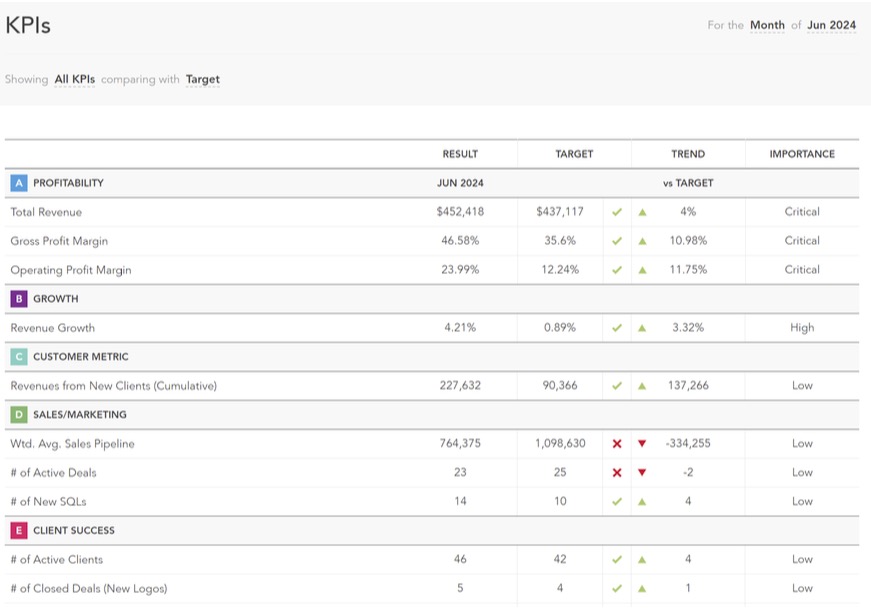
- Build a KPI Dashboard – Create a new tab in your financial and operational model and build a KPI dashboard. Set it to pull information automatically when you update your numbers each month.
Then, regularly review your numbers and analyze them for trends to ensure your company is on track. And be sure to revisit this process to make any necessary adjustments as your priorities change.
You can do this manually, using output from your accounting system and spreadsheets, or we can do it for you as part of our services where we can tap into efficiencies. After we get to know your business, we clean up your books and install TCRH’s reports tool (Right Hand Reports™) so you will always know where things stand. Then, we manage your accounting tasks and meet with you monthly to review your numbers.
The Bottom Line
In finance, we live by the saying, “If you can’t measure it, you can’t manage it.” But most leaders must avoid getting caught up in the details. Although you should know the metrics above, focus on your financial KPIs and track them over time. That will empower you to spot and address problems, benchmark your results against others in your industry, and set up relevant comp plans to reward your team’s performance.
At The CEO’s Right Hand, identifying such metrics is one of the first things we do when working with new clients, as it helps us find ways to fuel the company’s growth. Contact us today to learn what we can do for you.
Editor’s Note: This blog post was originally published in November 2021 and then updated for accuracy and thoroughness in August 2024.