

When your people are your product, delivering consistent and affordable services while turning a profit is challenging. The task may seem doable when your firm is small, but the entire operation can quickly go off track when growth occurs.
As a Financial Planning and Analysis professional, I work primarily with professional services clients and have seen this issue repeatedly. In nearly every case, the root of the problem is a need for better gross margin data. Below, I explain how to use gross margin for service business decisions and the steps you must take to capture and use the underlying data to boost profitability.
What is Gross Margin?
Gross margin (a.k.a. gross profit margin) is a financial metric that tells you how much money you make after subtracting the cost of producing and delivering your services from your revenues. This number is a ratio, so said differently, it is the percentage you retain from every dollar earned before backing out operational costs. You can calculate gross margin using the following formula.
(Total Revenues – Total Cost of Revenues)/Total Revenues = Gross Margin
The No-BS Financial Playbook for Small Business CEOs
Are you tired of making costly financial mistakes? Stop guessing and start growing. Learn how to create a scalable and valuable company while minimizing risk with this playbook from a serial entrepreneur who has been in your shoes.
Please note that although we use the terms “cost of revenues,” “cost of services,” or “cost of production” in production or service industries, product-based sectors, like manufacturing, use the term cost of goods sold (COGS). Don’t let the terminology trip you up – in all cases; these are costs directly associated with producing and delivering your product, such as raw materials, shipping costs, or labor (service providers, project managers, machinery operators, etc.).
Another point worth mentioning is that gross margin does not provide a complete picture of your company’s profitability because it excludes operating expenses and other costs (like taxes and interest). However, that is also part of its power. To generate a reliable gross margin figure, you must dig deep into your data, comparing apples to apples, to see how efficiently you produce profit. Then, that figure becomes a robust measure of financial health that you can compare with industry peers and track over time.
How to Use Gross Margin for Service Business Decisions
The gross margin calculation is critical because it provides insight into how much you spend to deliver your services compared to how much you make. At a high level, that can help you determine whether your work is paying off. A quick Google search would suggest that the average gross profit margin for professional services is roughly 30%, but in my experience, that would leave most firms pretty vulnerable. However, like many things, what is healthy for your company depends on your perspective.
For example, if you run a consulting firm as a lifestyle business and a 30% gross margin means you are breaking even or turning a small profit, that might be fine for your purposes. However, when we work with service-based companies that wish to grow and scale, we typically target a higher gross margin (~50-70%). So, if you want to take out a loan or attract an investor, you must look at that figure through their eyes. A lender may view 30% as risky if losing a key client or a shift in your costs would upset your balance, whereas an investor may see it as a sign that your business lacks growth potential.
Equally important, however, is what this number can tell you about how to run your business. First, you need to decide what figure is healthy for you. Then, if your gross margin is too low, you must determine why, and sometimes, that will mean making tough decisions. It could indicate that you need to adjust your pricing strategy, reduce headcount or expenses, become more efficient, or negotiate better contracts – letting go of costly clients and prioritizing those who will increase your profit margin.
Unfortunately, some service firms use income statements that don’t have a gross margin figure. Or perhaps the information exists, but they don’t know what it means or how to use it to tell a story. To illustrate what we would do in that situation, consider the following example.
Professional Services Business Example
The Problem
We often work with professional services companies that bill their clients on a time and materials basis. They typically seek our help when they realize they need to understand their costs better to make confident decisions about pricing, hiring, compensation changes, etc.
The Solution
First, we work to understand the nuances of the client’s business and which metrics would be meaningful to them. Then, we dive into their expense and time-tracking processes, procedures, and resulting information to understand every cost involved in delivering their services. We check whether they track them correctly and make any necessary adjustments. Finally, we look at their revenue recognition practices to ensure that we can match those costs to corresponding revenues.
This process is usually straightforward for companies that bill their clients on a time and materials basis because they already track time. We also perform this exercise with companies using project-based billing. That is usually more involved because we must also set up a time-tracking mechanism, but in either case, the results can be astounding.
The Results
Once we perform the clean-up and reconfigure the profit and loss statement, we show them how to use the information to see what is happening month to month. Then, we help them generate metrics critical to their business and develop forecasts. This insight is game-changing, making confident decision-making much more manageable. Below are some example income statements so you can see for yourself.
Example Income Statements
Here are screenshots showing a typical client’s income statement before and after we start working together. Before we begin, all costs appear under one operating expenses line.
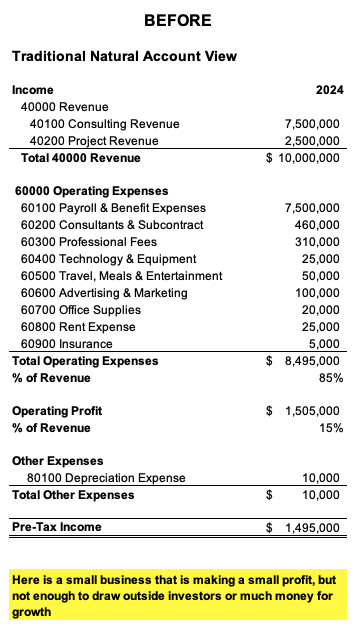
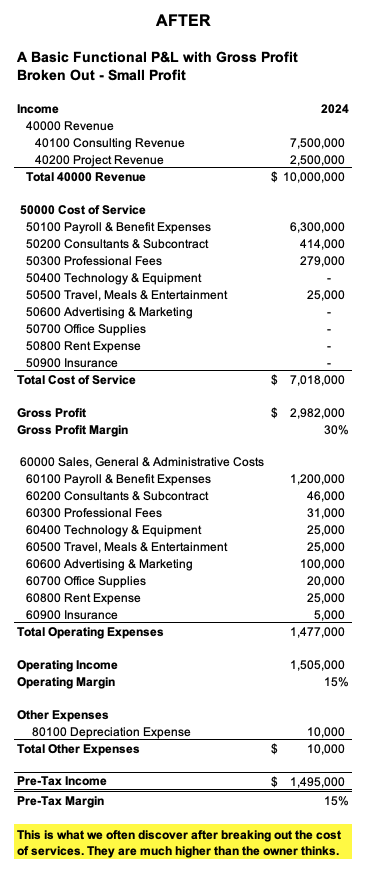
So, we break those costs into operating expenses and cost of services. That change alone is helpful, but we can also drill into the details behind those numbers to unearth more insights.
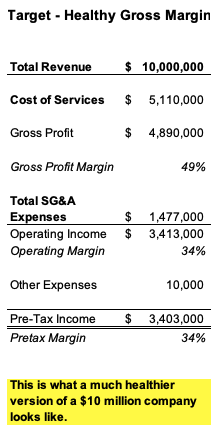
We can also use this new knowledge to set targets.
What Are the Signs of a Gross Margin Problem?
How can you know if you have a gross margin problem? The signs aren’t always easy to spot, but here are a few things to look for:
- You can’t answer basic questions about your costs. Sometimes, firms come to us after a failed acquisition or attempt to get a loan. Such deals can fall apart if you can’t produce this information.
- You struggle to make spending decisions, such as whether you can afford new technology or to hire more consultants.
- Your cash position is getting low, and you don’t know why.
But don’t wait until you encounter a problem. Follow the steps below to improve your data and decision-making abilities to increase your gross profit margin.
How to Increase Gross Profit in the Service Industry
Proper tracking and processes are the key to better financial data, but one must also know how to examine them for insights. The following steps should help you get started but don’t hesitate to reach out for expert advice tailored to your business.
1. Identify the Costs of Your Services and How You Need to See Them
You must collect the correct details to get the most from your financial data. Take a deep look at what you do for your clients and try to understand every cost directly related to delivering those services. Of course, gross margins for professional service companies include people costs, but are there other expenses to consider? And what exactly do your people do? How can you capture those costs in suitable buckets?
Once you are clear on all the costs involved in delivering your services, determine what data you must track and how much granularity you will need. For example, if you want to track hours for each consultant, you likely want to know which account they worked on, but then what? Do you need task-level data to determine which work takes the most time? If so, how would you like that information collected to ensure accuracy?
I’m not suggesting you micro-manage your staff, but determining when customers need more support or when employees can take on more work is impossible if you don’t track this data correctly. If you are uncomfortable doing this yourself or feel that you could benefit from someone with financial expertise, consider hiring a fractional CFO. They can help with this step and the ones that follow, potentially even modeling what the result will look like to ensure alignment before pressing forward.
2. Redesign Your Profit and Loss Statement
Adjust your chart of accounts and income statement to collect and display your financial information correctly. It will take some doing, and you will likely need someone with financial expertise (and a strong understanding of your accounting system) to set this up and adjust your historical data. However, this is a one-time investment that is well worth it.
3. Establish the Appropriate Tracking and Reporting Systems
Examine your underlying tracking systems. Can you capture and report the data you need correctly? If not, what must happen to make that possible?
Sometimes, companies think they track time correctly but realize, through this exercise, that their data could be more consistent. Developing processes, procedures, and controls and training your team to use them can go a long way to smoothing out any problems.
Then, think carefully about how you must present this data. Aside from the basic financial statements, what additional reports will your executive team need to make decisions? Many of our clients look at costs at the project level to see each engagement’s profitability, and most ask us to help them develop a key performance indicator (KPI) dashboard so they can quickly review their most important metrics. For example, here are some metrics most service businesses should track:
- Revenue per person vs. cost per person
- Revenue per hour vs. cost per hour
- Utilization rate (billable hours per person)
4. Build a Monthly Review Session into Your Workflow
Naturally, once you have the data you need, you must analyze it and use the information to increase your gross margin. For example, a rule of thumb in the service industry is to set your hourly rate at three times your cost of services, so if you incur $100 in expenses for every hour of services, that would suggest you charge $300 per hour. If that sounds right to you, and you already charge $300 per hour but have $200 in service costs, you must find a way to reduce your costs. Alternatively, you could try something else, like adding value to your services (to justify a higher price), allocating your resources differently, or adjusting your customer base (targeting clients who can pay a premium).
But this isn’t a one-time thing. You must develop a rhythm of reviewing your numbers regularly, tweaking whatever needs it, and tracking your progress over time. That will help you spot patterns in your data and address any new or persistent issues.
The Bottom Line
Tracking gross margin in the service industry is vital to running a profitable business, especially if your goal is to grow and scale your organization, taking it to the next level. Investing in doing it right is essential – that’s how you get reliable data that tells a story, preparing you for opportunities and empowering you to make confident and sound financial decisions. Contact us today to learn more about what we can do for you.