

One of the most critical responsibilities of your executive team is to stay abreast of your current and anticipated business performance so you can make informed decisions. Financial modeling is one way to make that possible. Financial modeling involves using data to analyze the potential impact of proposed initiatives or changes to your business so you can improve your budgeting and forecasting process.
In the following post, I will explore financial modeling in more depth, clarify some common areas of confusion, and explain the steps involved in building financial models.
Table of Contents
What Is a Financial Model?
A financial model is a tool (i.e., a spreadsheet) that allows you to gather all your data about a given situation and predict how it will affect your business performance.
The term “financial model” is sometimes used interchangeably with “forecast” because that’s what it is. It is a discrete forecasting model that focuses on one or more areas of your business and allows you to explore how certain conditions might play out. Then you can use what you learn to adjust the departmental budgets that roll into your high-level, company-wide forecast.
The No-BS Financial Playbook for Small Business CEOs
Are you tired of making costly financial mistakes? Stop guessing and start growing. Learn how to create a scalable and valuable company while minimizing risk with this playbook from a serial entrepreneur who has been in your shoes.
Financial Models vs. Budgets vs. Forecasts
Before we go further, let me define two related terms.
Budget
A company’s budget is simply an approved plan for how the organization expects to meet its financial obligations in the coming period, typically a year. It is essentially the playbook that each department head can use when making tactical decisions.
Forecast
Since no one can truly predict the future, most companies pair their budget with a forecast – a high-level assessment of the company’s performance (in comparison to its budget) with the numbers projected out so the company’s leaders can see how things are likely to evolve. In other words, the forecast is an updated version of the approved “plan” that shows how new information could affect outcomes.
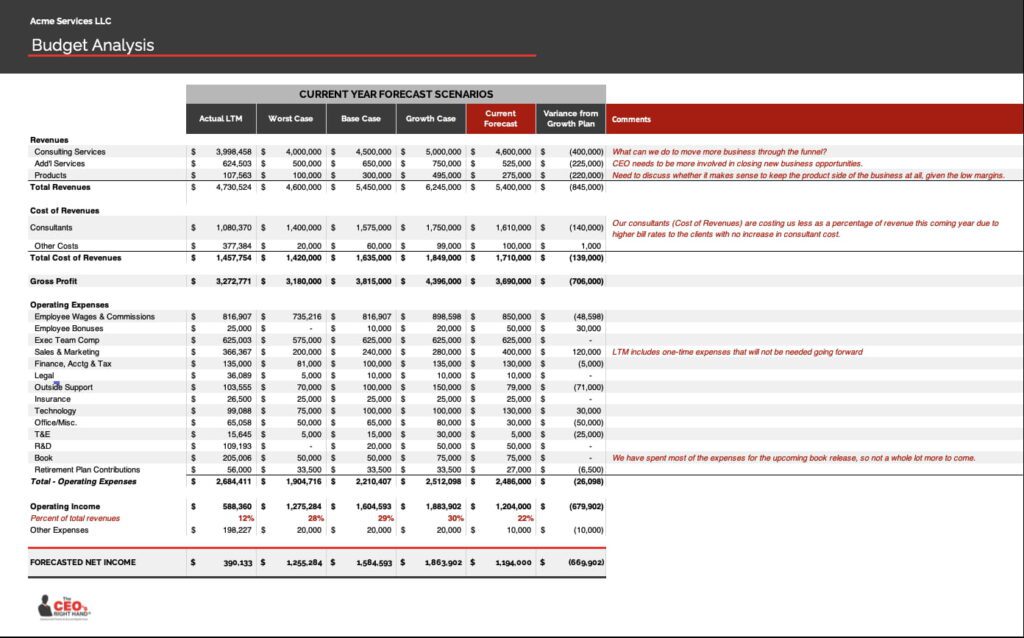
Well-run organizations use all three tools (financial models, budgets, and forecasts) together. First, they use financial modeling to get the information necessary to build sensible budgets. Then they track their progress and develop forecasts to identify and address any problem areas. Most companies refresh the data behind these tools monthly, but some operate in real-time, while others find quarterly is sufficient.
Below is a screenshot of an example budget analysis. However, we encourage you to download our financial report template for more insight.
Why Do Businesses Create Financial Models?
Essentially any decision that could affect your company’s ability to achieve its goals should have a financial model behind it. With a model, you can clearly see the “knobs and dials” of your business. Otherwise, you are flying blind.
Financial analysts can test the expected outcomes of various decisions by creating models, running different scenarios (best case, worst case, likely case), and performing a sensitivity analysis. They can also look for ways to improve the numbers by challenging the assumptions – searching for opportunities to increase revenue, cut costs, or reduce risk.
For example, here are just a few questions financial models can help you answer:
- How many people can I afford to hire, and what must occur before I can hire more?
- What will happen if our costs go up? How will it affect our overall cash flow forecast, and what can I do about it?
- How long will it take to achieve a target ROI if I invest in product development, equipment, or new technology?
- Can I afford to acquire another company? If not, would it make sense to explore a leveraged buyout (LBO), or would it be better to get the funds another way?
- Am I going to run out of money? If so, when? How can I improve cash flow to grow my “runway?”
- What should I change about my business to address a shift in demand?
- Does it make sense for me to buy what I need, or would it be better to build it myself?
- If I need to raise capital, what would be best for my company: debt or equity financing?
Of course, the utility of financial modeling goes beyond corporate finance. For example, your sales team might use models to demonstrate the ROI of your solutions to prospects. Equity researchers might build financial models to project how certain market conditions could affect a company’s stock price. And in the investment banking industry, analysts can develop models to analyze the earnings potential of merger and acquisition targets.
What Are the Most Common Types of Financial Models?
Companies typically create at least two types of models – a sales model and an operating cost model. The sales model shows how much money the business expects to make, while the operating cost model tracks the organization’s expenses. If either model indicates that the company could miss its profit goals, its leaders can quickly develop strategies to address the situation.
Now, you certainly don’t have to stop at two models. Depending on the size and complexity of your business, you could potentially have hundreds of models – each one designed to analyze various aspects of the company. Here are just a few common types of financial models you might encounter:
- Sales models
- Capital expenditure models
- Pricing models
- Buy vs. build models
- Discounted cash flow (DCF) models
How to Build a Financial Model

So, what is the step-by-step process for financial modeling? Since each financial analysis is unique, it can vary somewhat, but below is the basic workflow:
- Prepare for Financial Modeling
Think through the purpose of the model. For example, who is the target audience? What questions do they need to answer, and what information will help them make effective decisions? Then, clarify the desired output and the information required to perform the analysis. - Gather Any Necessary Data
This step involves the collection of internal and external data. For instance, you might need historical data from your financial statements (income statement, balance sheet, and cash flow statement) and forecasted data about specific salaries or other costs. In addition, you may need to do market research to track down external information such as projected market size or inflation rates. - Build Out Any Necessary Schedules
Once you have everything you need, put together your schedules. These are individual sheets in your Excel document where you can capture discrete data sets for your calculations, such as the cost of supplies or payment schedules. - Develop Your Calculations
Now, with all the data at your fingertips, you are ready to build the summary sheet. First, design the summary to show only pertinent information. In other words, monthly amounts are appropriate if it is a short-term model. But if it is a longer-term model, stick to quarterly or annual figures. Then, build in critical financial and operating metrics.
The situation in question will drive the overall format. For example, to assess the potential profitability of a new product, you will need tabs (schedules) for component costs, pricing information, and other types of data, in addition to the summary sheet. But to explore the ROI of buying a new technology vs. building it yourself, you will need other data types, such as development costs. - Add Sensitivity Analysis
After you complete your baseline model and feel that your calculations are sound, the fun starts. In this step, build in the ability to run different scenarios to see what will happen if any of your assumptions are off or things don’t go as planned. For instance, your sensitivity analysis can help you see the potential impact of a price increase. - Perform Quality Assurance
When you believe you have everything dialed in, run some experiments to see if you can break the model. That will help you spot math or assumption errors you may have missed before sharing the information with anyone important. - Document Your Assumptions
Since model building is complex, keeping track of your assumptions and other inputs is critical. That will protect you and the organization if you forget something or become unavailable. But don’t wait until the end. This step typically occurs parallel with the others to avoid missing things. - Prepare the Executive Presentation
With your analysis complete, it is time to combine it into a concise, easy-to-consume presentation format. Share the most critical data using charts, graphs, or anything else that will help you tell your story and gather feedback. - Perform Iterations
Every so often, you will learn what you need from a financial model, and that will be it. But most of the time, models live on in a constant state of iteration. When new data becomes available, you refresh the numbers and check your analysis to ensure everything remains on track.
Please understand that the steps above are for illustrative purposes only. Financial modeling is not a linear process. Instead, you will jump around, filling in missing information, documenting your assumptions, and checking your math until you get to a point where you can gather feedback and iterate.
Financial Modeling Skills and Best Practices
Building a financial model is not easy. Therefore, a good analyst will have particular skills. For example, most companies do at least some (if not all) financial modeling in Excel or Google Sheets, so exceptional spreadsheet and math skills are non-negotiable. However, most accounting and business management solutions now include financial modeling templates, so familiarity with your technology also helps.
In addition to technical skills, analysts also need strong organizational, analysis, critical thinking, and communication skills. A great analyst will possess the necessary business acumen to question the numbers, track down any erroneous data, and use what they learn to tell a story. And they should also be comfortable explaining what they have discovered to people across all functions and levels.
Finally, when building models, it is essential to be mindful of the target audience and how the company will use the model. For example, people will appreciate an area for easy input, a clear and logical layout, formatting for readability, and easy-to-follow math. In other words, the model should be transparent so the end-user can easily follow along.
Financial Model Examples
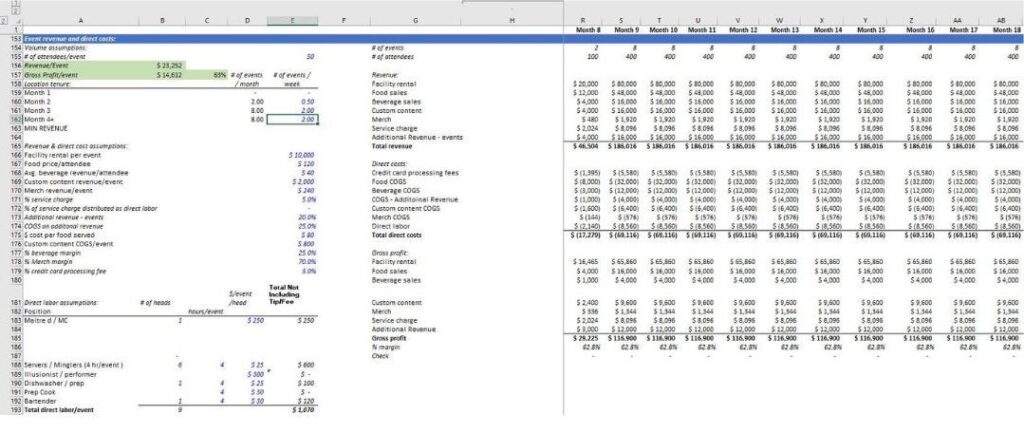
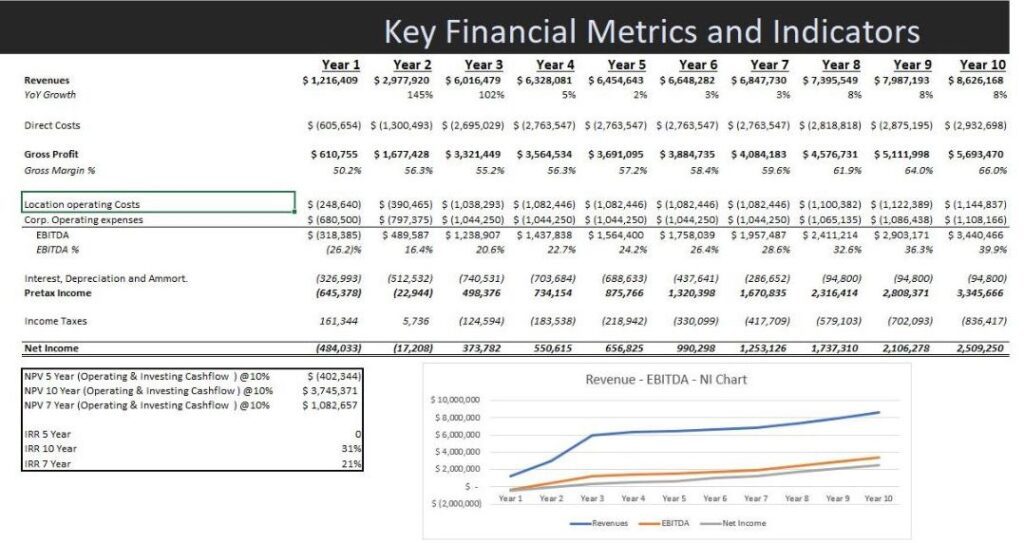
So, what do financial models look like in the end? They vary, of course, depending on the situation. But most of the time, the only person who sees the actual model is the financial analyst. Most people simply want to see the resulting charts and graphs.
For example, below is a screenshot of one sheet of a financial model, followed by a screenshot of the executive presentation. As you will see, one is much easier to digest than the other.
The Bottom Line: What Is Financial Modeling?
Financial modeling is a vital activity that allows you to analyze the potential impact of proposed initiatives or changes to your business and make better decisions. It is a key part of any budgeting and forecasting process that will empower you to answer nearly any question you may have about running a financially viable company. We encourage you to reach out to discuss how our fractional CFOs can help you develop such a process for your organization.