

Understanding how to read financial statements is valuable because it gives you the knowledge to assess an organization’s economic health and make strategic decisions. However, although accounting and finance professionals receive detailed training on this topic, many other disciplines do not, putting some business professionals, including company owners and leaders, at a disadvantage. As a financial planning and analysis (FP&A) consultant, I help my clients cope with this challenge daily, so I wanted to share the high-level basics below.
Table of Contents
What are Financial Statements?
Financial statements (a.k.a. financial reports) are documents used to communicate a company’s business activities and financial performance. Organizations must produce these statements for legal and tax reasons, but they are helpful for many other purposes. For instance, leaders use the information internally to analyze their results and guide decision-making. They also use them externally to communicate with investors, bankers, shareholders, and other stakeholders.
Financial reports in the for-profit world consist of the following three documents:
- Income Statement (a.k.a. profit and loss statement (P&L)): Shows how much revenue a company has earned and how much it has spent.
- Balance Sheet: A snapshot of what you own and owe as of a specific date and time.
- Cash Flow Statement: This report connects the income statement and balance sheet. It shows the details of cash entering and leaving the business.
Nonprofit organizations also produce these documents, but instead of revenue, they report the receipt and usage of grants, donations, etc. That adds some terminology, accounting, and analysis nuances that go beyond the scope of this blog. So, for our purposes, we will focus on for-profit financial statements.
The No-BS Financial Playbook for Small Business CEOs
Are you tired of making costly financial mistakes? Stop guessing and start growing. Learn how to create a scalable and valuable company while minimizing risk with this playbook from a serial entrepreneur who has been in your shoes.
How do Companies Use Financial Statements?
Each core financial statement has a slightly different purpose, and, as I will show you below, the information is relatively simple to understand. However, in isolation, each report only presents the basics. For example, your income statement’s revenue and expense breakdown is meaningless without additional context.
The magic occurs when you use the information to perform analyses and develop insights into what is going on with the business. That allows you to use your financial reports for the following activities and more:
- Assessing your company’s financial health and viability, along with any changes
- Spotting and analyzing trends – empowering you to pursue opportunities and remedy issues
- Comparing your company to industry benchmarks
- Building financial models to develop and analyze budgets, forecasts, and proposed business initiatives before making decisions
- Identifying key performance indicators (KPIs) and setting goals for business management
- Preparing for and pursuing funding, investment, and merger and acquisition (M&A) opportunities
Generating these insights typically requires the expertise of a financial professional, ideally one with knowledge in your field, because the way we create and use financial statements differs depending on the industry. It also requires a long-term commitment to regular reporting and meetings with your leadership team to review and discuss the results. That said, the first step is learning how to read financial reports at a basic level, so let’s dive in.
Understanding Financial Statements
Income Statement (a.k.a. Profit and Loss Statement (P&L))
An income statement details your revenues and expenses – how much money you made, how much you spent, and the resultant gains and losses over the given timeframe (typically a month, quarter, or year). However, you must break the information down correctly to gain insight into specific business areas. For instance, a well-crafted income statement will contain the following sections and a breakdown within each section:
- Revenue (Broken into types of revenue)
- Expenses
- Cost of Revenues (for service-based industries) or Cost of Goods Sold (COGS) (for product-based industries): These are expenses directly associated with delivering your products or services, such as wages, taxes, and benefits for the consultants who provide your services or people and material costs to build your products.
- Operating Expenses: These costs are not directly related to delivering services or producing products. Examples include wages, taxes, and benefits for sales, marketing, product development, customer service, and administrative costs such as technology, legal, and insurance.
- Other Expenses: Expenses that don’t fall into the prior two categories, such as depreciation expenses or interest on any debt you may have.
Here is a real-life example from one company’s annual report.
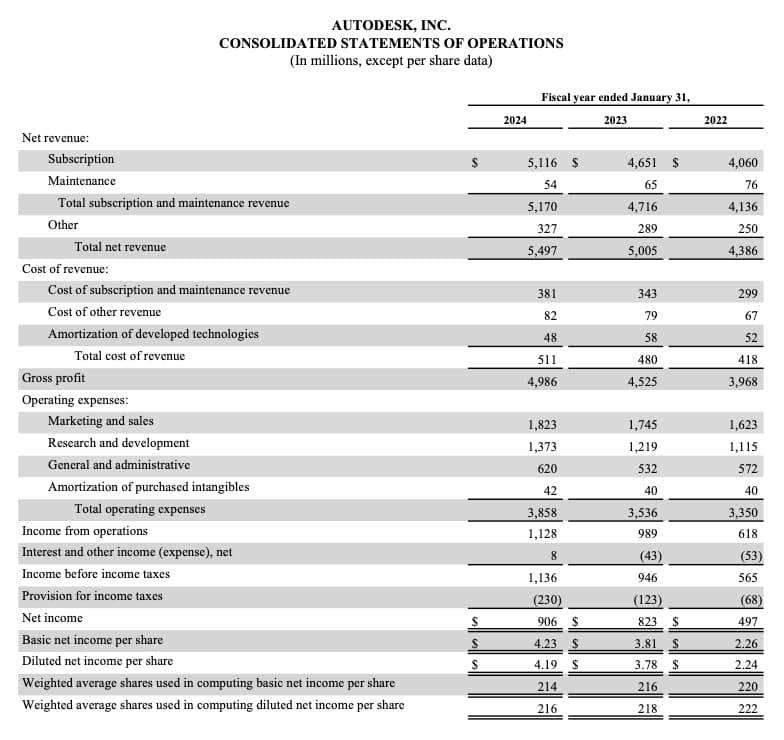
Tips for Reading an Income Statement
When I work with clients, I like to customize the income statement to show their current results against relevant prior period numbers and the budget so they can see simple trends. Out-of-the-box income statements don’t typically show that information, but I can still glean some insights by reviewing the following figures:
- Income and Total Income
Naturally, I want to see steady income growth, but perhaps more importantly, I want to know where the income comes from and how it changes over time. - Costs of Revenues or COGS and Gross Profit (Income minus Costs of Revenues or COGS)
Most product-based companies track their cost of goods sold very closely, but many service-based organizations need work in this area. So, first, I look at whether they are capturing this figure correctly. Then, I examine the company’s gross profit margin (gross profit divided by total income = gross profit margin) compared to industry standards. Gross Profit indicates how efficiently a company delivers its product or service and is a key indicator of financial health and good management. - Operating Expenses
I want to know how much a company spends on operating expenses in total. More importantly, I want to see the breakdown to spot their most significant expenses (and potential efficiency opportunities). For example, if a company spends a lot on marketing, that’s okay, but I want to know what that figure consists of, how it has changed over time, and why. Also, I expect revenue growth if a company spends heavily on marketing. - Operating Income (Total Income minus (COGS + Operating Expenses))
This figure tells us how much the company made from its operations. However, like gross profit, I am less concerned with the total than the margin (operating income divided by total income = operating margin) compared to industry norms. - EBITDA (Earnings Before Interest, Taxes, Depreciation, and Amortization)
EBITDA is fascinating because it smooths out the numbers and allows you to focus more closely on how much profit the company makes through its operations. Also, many investors use EBITDA to develop a valuation estimate, so noting how it changes over time can give you a good sense of whether the company is focusing on driving improvements.
I mentioned earlier that context is vital when evaluating these numbers. If your organization offers services, consider reading How to Read an Income Statement for a Service Company for more insight.
Balance Sheet
The balance sheet shows what your company owns (assets), what you owe (liabilities), and how much investment there is in your business (equity) at a given point in time. As such, it is split into three main parts (Assets = Liabilities + Shareholder Equity) and then broken down further to provide additional context as follows:
- Assets
- Current Assets: very liquid (convertible to cash in less than 12 months)
- Non-Current Assets: illiquid (cannot convert to cash for 12 months+)
- Liabilities
- Current Liabilities: payable within 12 months
- Non-Current Liabilities: not due for 12 months+
- Shareholders’ Equity: Money received from investors minus payments made to investors plus cumulative net income. Most companies break this down into shares owned and retained earnings (profits not paid in dividends).
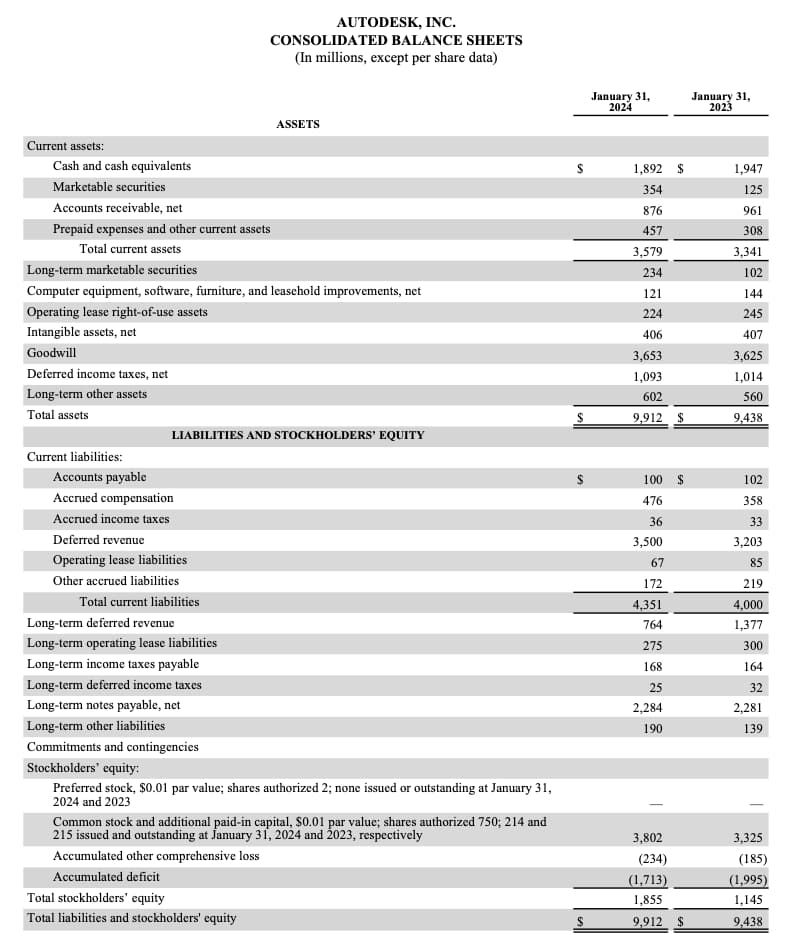
Tips for Reading the Balance Sheet
When working with clients, we extract information from the balance sheet to show essential ratios. The right ones for you will depend on your business, but in general, I recommend looking at the following items to get an overall sense of how a company is doing:
- Current Assets vs. Current Liabilities (a.k.a. Current Ratio)
Simply put, we typically want current assets to be greater than current liabilities because that suggests the company can meet its financial obligations in the short term.
However, you can take this further by combining this report with the cash flow statement. Comparing the difference between current assets and liabilities with the company’s monthly average cash flow will provide insight into how many months of cash they have. For example, if an organization has $1,500,000 in current assets and $1,200,000 in current liabilities, they have $300,000 in cash. If they spend $150,000 monthly, they could run out of money in two months, which might be risky, depending on the business. - Total Liabilities vs. Total Assets (Debt/Asset Ratio)
As the name implies, this ratio compares a company’s total debt to the sum of its assets. A ratio greater than 1.0 tells you a company has more debt than assets.
This ratio varies significantly by industry, with some capital-intensive sectors regularly carrying a high debt-to-asset ratio while others have a much lower one. Within any specific industry, a company with a higher ratio is more likely to face future financial challenges than a competitor with a lower ratio. - Accounts Receivable (A/R) and Accounts Payable (A/P) Size and Trend
Finally, I look at the total volume of the company’s A/R and A/P figures. In this case, I’m looking for consistency with industry standards and the month-to-month trend. Ideally, the total figures will remain relatively steady, suggesting that the company bills and receives payments regularly and honors its financial commitments.
Cash Flow Statement
The cash flow statement shows how money flows in and out of a company due to operational timing differences. In other words, it connects the income statement and balance sheet to show how a company’s revenue becomes assets on the balance sheet and the cash it needs to function. We break this activity down into the following sections and track the data month-by-month to see how well the company is running.
- Operating Activities – cash changes due to the everyday operations of your business
- Investing Activities – cash changes due to spending on assets such as property, plant, and equipment in manufacturing or capitalized internal-use software in the service industry.
- Financing Activities – cash changes due to debt and equity activity
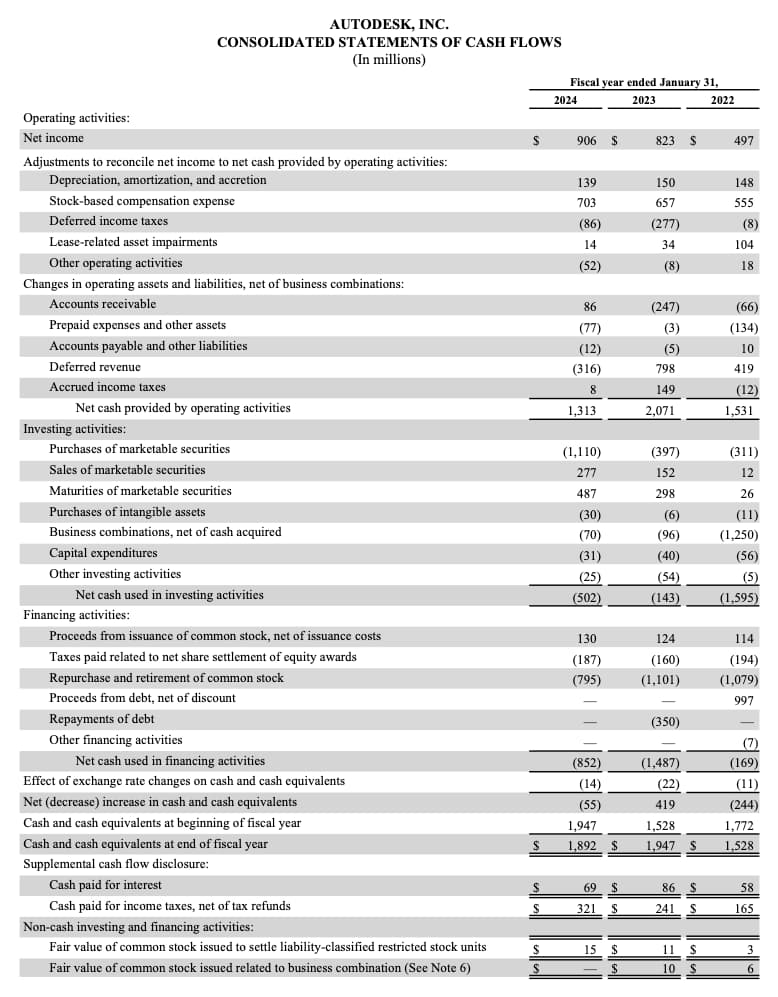
Tips for Reading the Cash Flow Statement
In cash flow statements, ups and downs within each category are normal. In the standard course of operations, you invoice customers, and it takes them some time to pay. Likewise, you might buy something, pay it off over time, and show it as a liability on your balance sheet. The cash flow statement shows this movement – a positive number means the money is in your account, and a negative number appears when money leaves your account.
In general, you want to see a relatively positive overall cash flow. You know you might have a problem when one area grows more negative or positive month after month. So, when reading a cash flow statement, we look for upward or downward trends within each category. We also look for significant changes and investigate the cause by reviewing the relevant income statement or balance sheet section. For example, consider the following activity:
- Operating Activities
If the accounts receivable line grows increasingly negative, that could mean you have a collections issue. If your accounts payable line is positive and growing, you are taking on more liabilities. However, you can typically expect temporary growth in your payroll line due to accrued money for paying taxes, funding 401k accounts, or paying bonuses. - Investing Activities
This section shows money spent on assets the business uses to produce its product or provide its services. Depending on the industry, some companies must spend heavily on assets, while others will have little spend here. If you notice high depreciation or amortization costs on an income statement, you will likely see large amounts spent on investing activities. - Financing Activities
The financing section of the cash flow statement shows how a business pays for its operations above and beyond the cash it generates. Companies in capital-intensive industries will show money received from new debt and payments for existing debt. Venture capital-backed companies will show increases in equity from cash received from investors, and other companies may show money spent on dividends or other shareholder distributions.
The Month-End Reporting Package
Of course, although it is always great to have first-hand knowledge of the basics, digging through financial statements and mining them for insights may not be the best use of your time if you are a company owner. Instead, most leaders hire a fractional CFO to do this for them and to provide advice.
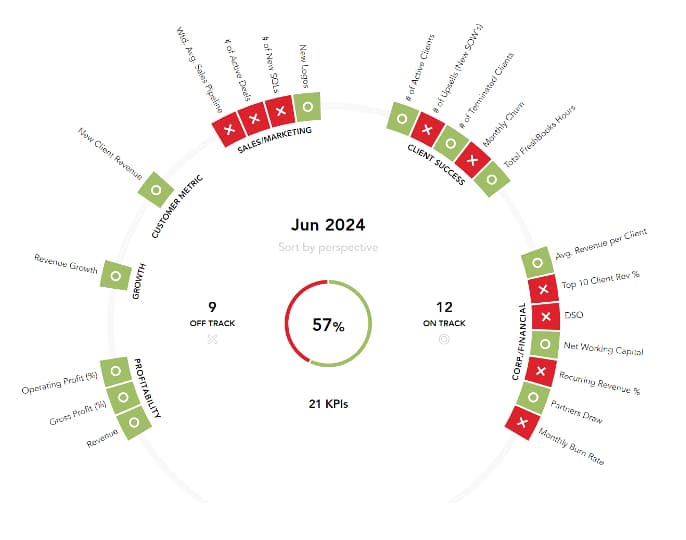
Ideally, they will streamline this process, generating a month-end reporting package that combines your financial reports with forecasts, analyses, and other relevant information. Here are a couple of examples.
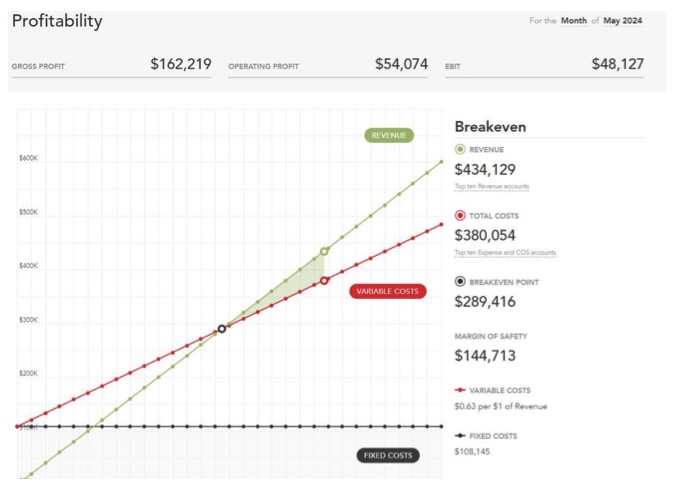
Then, during regular meetings, they will review this information with you and others on your management team and provide strategic advice.
How to Read Financial Statements: The Bottom Line
Understanding how to read financial statements takes practice, but it gets easier once you become familiar with the essential components and what they mean. The tricky thing is that you need to know how to analyze the information to generate the insights you need to make strategic decisions. That requires someone who understands basic accounting and finance best practices and the nuances of your industry and business so they can provide context and help you determine which variances are normal versus red flags.
We encourage you to reach out to learn how we can help.