
You look at your bank balance and you see that you have plenty of cash available.
You have plans to grow the business, but you are not sure if you can afford to make any investments.
Your bookkeeper tells you that you are making money, but there are swings that occur periodically and you aren’t sure why.
To compound the issue, you get a larger than expected tax bill because your accountant tells you that you made more money than originally expected. (A good problem to have, but a problem nonetheless).
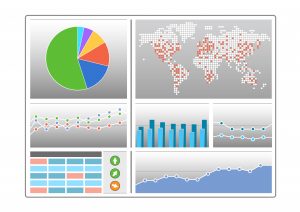
These are the types of issues with which CEO/founders are often confronted. Having clear analytics of your business’ data and reporting on the key indicators of your business will help you understand where your business is currently, and more importantly, by looking at the trends, where it is headed in the future.
What types of analytics are important?
Which ones should you focus on?
There are many online tools available that can help you sort through the data you are collecting or that is currently available from your existing solutions, e.g. your accounting system. You want to determine the key pieces of data that will help you evaluate the health/success of your business. These are typically called Key Performance Indicators (KPIs). KPIs vary by business type so there is not one all-encompassing list. What might be important to a manufacturing firm (asset utilization, availability, avoided cost, capacity utilization, waste reduction) will not be applicable to a non-profit organization (gifts secured, donation growth, pledge fulfillment growth, online gift percentage) or a regional financial services firm (working capital, payroll headcount ratio, return on equity, finance error, payment error, etc.)
Analysis of your company’s performance spans multiple areas: revenues, operating expenses, assets (cash, inventory, equipment, etc.), liabilities (payables, debts), and operational activities (e.g. number of units sold, price per unit, number of employees, number of billable hours, etc.). When evaluating which KPIs to use, there are a few considerations to help guide you:
- Choose only a few to start. Focus on those few KPIs that are critical to analyzing your business and that you know you have data for. As an example, for a software company, the list could be: average monthly recurring revenue (MRR) for the past 3 months, operating income, and number of seat licenses sold in the past 30 days.
- Review the data for accuracy. To create the analytics needed to make informed decisions, begin with the data. You can create the best KPIs in the world, but if you don’t have the data necessary to create them on an ongoing basis, they become ineffective.
- “Garbage in. Garbage out.” This axiom applies every time. Good decisions are impossible with bad analytics, based on poor data. Analyze the underlying data thoroughly so you don’t rely on misleading information.
- Translate the data into actionable items. Choose KPIs that enable you to make important, timely, and effective decisions. Avoid, for example, taking the time to analyze revenues per employee, if employee productivity is not something you need to know or will decide to change. In some cases, while something like this example could be important down the road, it is not actionable today.
Once you selected the KPIs that will enable you to effect meaningful change, you want to put in place a mechanism to measure and track them so you can analyze the results over time. If, for example, you see MRR (monthly recurring revenue) trending downward even though you know sales are increasing, then you can talk with your sales and service teams to determine what is causing the downward pricing pressure.
Using your company’s metric data (beyond financial measures alone) to analyze current and potential performance is key among business success and reaching defined short and long term goals. In combination with the evaluation and assessment of various business markers, the implementation of KPIs is typically a four-step process:
1) Company translates its corporate vision into measurable goals and communicates it to employees.
2) These goals are linked to individual performance goals which are assessed routinely.
3) Internal processes are created to meet and/or exceed the company’s goals and the customer’s expectations.
4) KPIs you selected are analyzed and evaluated to make recommendations for improvement.
However, no matter if your company is using these metrics to fix your problem or prevent the problem and proactively help you plan and manage your continued success, you will benefit immensely from clear-cut reporting and modeling tools to increase your visibility into your company’s future outlook.